Yap GIS

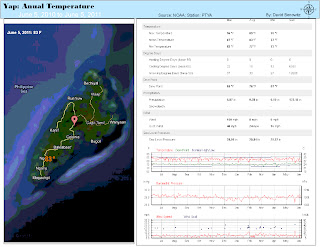
A summary of the yearly temperature changes of Yap island from June 5, 2010 to June 5, 2011


A true-color satellite image of Yap Island obtained on March 5, 2000. The image was corrected to remove a common "band striping" error that occurs on modern satellite images from the Landsat 7 satellite. Ocean water has been masked-out. There is a cloud cover on a significant portion of the Island which reduces the viewable area. On the viewable area we can see agricultural plots (brown) and evergreen vegetation (green).
A Landsat 7 image was obtained in March of 2000 and corrected for band striping and the ocean has been masked-out as well. A Normalized Difference Vegetation Index (NDVI) was done in ENVI using bands 4 and 3 of the image. A false-color image was created that allows vegetation to standout. The brighter the red, the stronger the vegetation in that area. Soil appears more neutral.

Landsat 7 images were acquired on March 2000 and March 2010. These images were corrected for band striping and a Normalized Difference Vegetation Index (NDVI) was conducted individually using bands 4 (Near IR) and 3 (Red) of Landsat 7. A Change Detection analysis was conducted using ENVI software to reveal positive, negative, and neutral changes of the images. A significant portion of the analysis was affected by cloud cover so it is important to focus on the Area of Agroforesty (Green outline) because in is unaffected by clouds. This area is also significant because it is where farming is conducted which could be harmful to the habitat. The temperature on the particular day as well as the orientation of the satellite may distort the results. Images taken on the same month were chosen to reduce seasonal variations of topography.

Landsat 7 images obtained in March of 2000, 2005, and 2010 and corrected for band striping. An Normalized Difference Vegetation Index (NDVI) was conducted on each image resulting in a single grayscale for each year. The brighter the pixel of the image, the stronger the vegetated area. Each image was designated a color and projected on the RGB scale: Blue- 2000, Green- 2005, and Red-2010. due to overlapping cloud cover, much of the island is not viewable. Areas unaffected by cloud cover are in the North of the island and made prominent by being outlined in red. These areas also appear to be areas of possible agriculture use.


A previously classified image image obtained from the Globcover server. The resolution is poor-- each pixel is 300 meters-- because the island is so small. The ground cover  of the island is divided into classes based on vegetation.


Data spans from March 1-10 of the year 2000. The Colors represent precipitation in millimeters while the numbers represent sea surface temperature in Celsius. The Island of Yap received around 10 to 20 mm of rain during that span and the surround sea surface temperature was 29.4 C.